
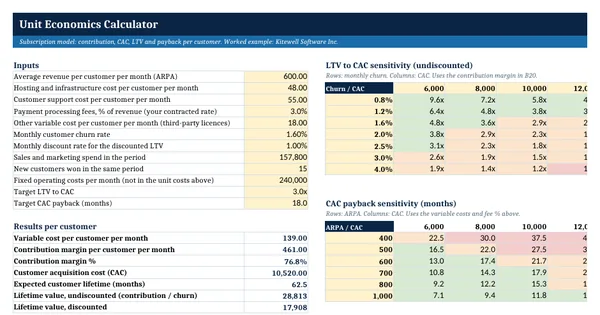
 Excel workbook preview
Startup and small business finance
Unit Economics Calculator
3 free downloads per account. Just your email and a 6-digit code.
About this template
Unit economics show whether one customer is worth more than it costs to win and serve. The core figures are contribution margin per customer, customer acquisition cost, lifetime value and the months it takes to earn back the acquisition cost. Investors ask for them before a round, and a finance team needs them to decide where the marketing budget goes and whether growth is creating or destroying cash.
The calculator has three views. The subscription sheet works out contribution, CAC, plain and discounted lifetime value, payback and break-even customers, with two sensitivity grids. The per order sheet does the same for businesses that sell order by order. The channels sheet compares acquisition channels side by side and ranks them. Every result is a live formula on visible inputs, built on standard unit economics arithmetic.
Who it is for
The founder or finance manager asked by an investor or the board whether each new customer makes money and how long CAC takes to come back.
What is inside
- Subscription sheet with 12 inputs and 13 results: contribution margin, CAC, lifetime, LTV, discounted LTV, LTV to CAC and payback
- Break-even customer count against fixed operating costs
- LTV to CAC sensitivity grid (7 churn rates by 5 CAC levels) and a CAC payback grid (6 ARPA levels by 5 CAC levels), coloured against your targets
- Per Order sheet for order-based products: contribution per order, first-order profit, orders to recover CAC and 12-month value
- Channels sheet with 8 worked acquisition channels and 12 blank rows: CAC, LTV, LTV to CAC, payback, rank and status
- Blended row for all channels, weighted by new customers and revenue
- Green, amber and red verdicts against your own LTV to CAC and payback targets
How to use it
Enter ARPA, variable costs per customer, churn and one period's sales and marketing spend and new customers on the Subscription sheet.
Files
- XLSXunit-economics-calculator.xlsx15 KB
Opens in Microsoft Word or Excel, Google Docs or Sheets, and LibreOffice. Based on general finance practice, not on one published standard. A template to adapt, not legal, tax or accounting advice.
Questions about this template
What is a good LTV to CAC ratio?
There is no official standard. Many investors look for lifetime value of about three times the acquisition cost, but the right level depends on cash, margins and how reliable the churn estimate is. The template lets you set your own target and shows how the ratio moves with churn and CAC in a sensitivity grid.
Why use a discounted LTV?
An undiscounted lifetime value treats a dollar earned five years from now the same as a dollar today. The discounted version applies a monthly discount rate, so distant contribution counts for less. With low churn the two can differ a lot, and the discounted figure is the more cautious one to show investors.
What should be included in CAC?
Include all sales and marketing cost for the period: paid media, events, agencies, tools and the salaries and commissions of the sales and marketing teams. Divide by the new customers won in the same period. Leaving out salaries makes CAC look far lower than the business actually pays.