
 Excel workbook preview
Order-to-cash and accounts receivable
DSO Calculator and Receivables Dashboard
3 free downloads per account. Just your email and a 6-digit code.
About this template
Days sales outstanding (DSO) estimates how many days of sales are tied up in receivables. A single DSO figure can mislead, because it moves with sales volume as well as with collection performance. Pairing it with best possible DSO, which counts only balances that are not yet due, shows how many days come from customers paying late rather than from the terms you offer.
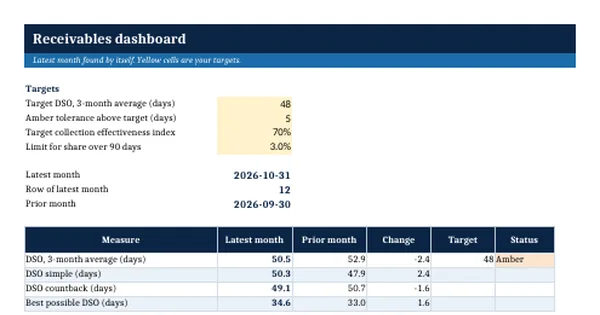
This workbook calculates three DSO methods each month, then best possible DSO, average days delinquent, the collection effectiveness index and the share over 90 days. The Dashboard picks up the latest month by itself, shows the change against the prior month, rates each measure against your targets and charts a rolling twelve months. The formulas are general credit practice and are written out in full on the How to use sheet.
Who it is for
The controller or credit manager who reports receivables health to the CFO or the board each month and needs a DSO they can explain.
What is inside
- Monthly data sheet with 12 worked months and 16 blank formatted rows
- Three DSO methods per month: simple, three-month average and countback
- Best possible DSO, average days delinquent, collection effectiveness index and share over 90 days
- Dashboard sheet that finds the latest month by itself and compares it with the prior month and target
- Green, Amber or Red status for each KPI from input targets and tolerances
- Rolling 12-month trend table and a line chart of DSO against best possible DSO
- How to use sheet with every formula written out
How to use it
Enter your monthly credit sales, ending receivables and current and over 90 day balances, then set your targets on the Dashboard.
Files
- XLSXdso-calculator-and-receivables-dashboard.xlsx18 KB
Opens in Microsoft Word or Excel, Google Docs or Sheets, and LibreOffice. Based on general finance practice, not on one published standard. A template to adapt, not legal, tax or accounting advice.
Questions about this template
What is the formula for DSO?
The simple formula is ending receivables divided by credit sales for the period, multiplied by the days in the period. A three-month average divides ending receivables by the last three months of credit sales and multiplies by the days in those months. The countback method subtracts each month's sales from receivables, newest first, until the balance is used up.
What is the difference between DSO and best possible DSO?
DSO uses all receivables. Best possible DSO uses only receivables that are not yet due, so it shows the DSO you would have if every customer paid on time. The difference, average days delinquent, measures the days lost to late payment. If DSO rises but days delinquent stay flat, the cause is usually terms or sales mix, not collections.
What is a good collection effectiveness index?
The index compares what was collected in a period with what was available to collect. A figure of 100% means everything collectible was collected. There is no official benchmark. A monthly index for a business on Net 30 terms with some late payers sits well below 100%, about 67% in the worked example. Compare the figure with your own trend, and enter your own target on the Dashboard.