

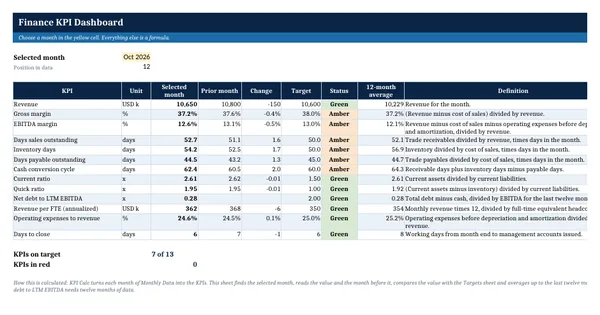
 Excel workbook preview
Finance governance and board reporting
Finance KPI Dashboard Template
3 free downloads per account. Just your email and a 6-digit code.
About this template
A finance KPI dashboard puts the handful of numbers that show the health of the business on one page each month: margins, working capital days, liquidity, leverage, productivity and close speed. Leadership teams and boards ask for one when monthly reporting is long on detail but short on trend, or when nobody can say whether receivable days are getting better or worse.
The workbook has one input sheet with twelve worked months for an invented manufacturer, a calculation sheet where every KPI is a live formula, a targets sheet and a dashboard that shows any chosen month against target, the prior month and the twelve-month average. The definitions use plain arithmetic, such as receivables divided by revenue times days in the month, so anyone can check them.
Who it is for
The finance manager or CFO who was asked for a monthly KPI dashboard for the leadership team or the board and needs one that calculates itself.
What is inside
- Monthly Data sheet with 12 worked months and 12 blank months of yellow input cells
- KPI Calc sheet with 19 live formula columns per month, from gross margin to days to close
- Dashboard sheet: pick a month and 13 KPIs show the value, prior month, change, target, status and 12-month average
- Targets sheet with target, amber threshold, direction and definition for every KPI
- Red, amber and green status by formula, colored by conditional formatting
- Revenue and cost of sales line chart on the Dashboard sheet
- Last twelve months EBITDA and net debt to EBITDA once twelve months are entered
How to use it
Overwrite the yellow cells on the Monthly Data sheet with your own month-end figures, then set your targets on the Targets sheet.
Files
- XLSXfinance-kpi-dashboard-template.xlsx22 KB
Opens in Microsoft Word or Excel, Google Docs or Sheets, and LibreOffice. Based on general finance practice, not on one published standard. A template to adapt, not legal, tax or accounting advice.
Questions about this template
Which KPIs should a finance dashboard track?
Most finance teams start with gross margin, EBITDA margin, receivable, inventory and payable days, the cash conversion cycle, current and quick ratios, leverage and the days taken to close the books. The best set is the one the leadership team will act on, so keep it short and add a target to every line.
How is DSO calculated in the dashboard?
Days sales outstanding equals trade receivables at month end divided by revenue for the month, multiplied by the number of days in that month. The same pattern gives inventory and payable days using cost of sales. The cash conversion cycle is receivable days plus inventory days minus payable days.
Why does net debt to EBITDA stay blank at first?
The ratio uses earnings before interest, tax, depreciation and amortization for the last twelve months. Until twelve months of data are entered, the twelve-month total is incomplete, so the formula leaves the cell blank rather than showing a ratio that would overstate leverage.
More Finance governance and board reporting templates
Finance governance and board reporting
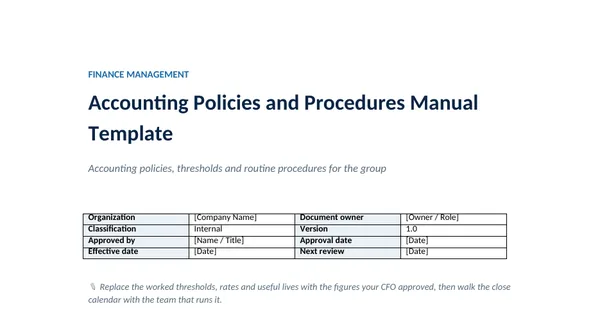
Accounting Policies and Procedures Manual Template
Finance governance and board reporting
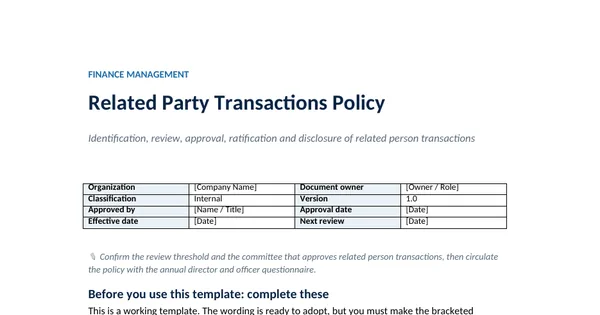
Related Party Transactions Policy
Finance governance and board reporting
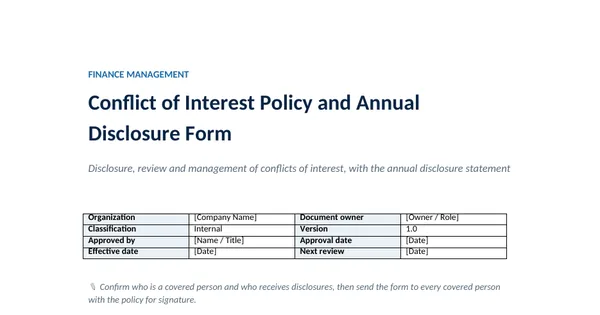
Conflict of Interest Policy and Annual Disclosure Form
Finance governance and board reporting