

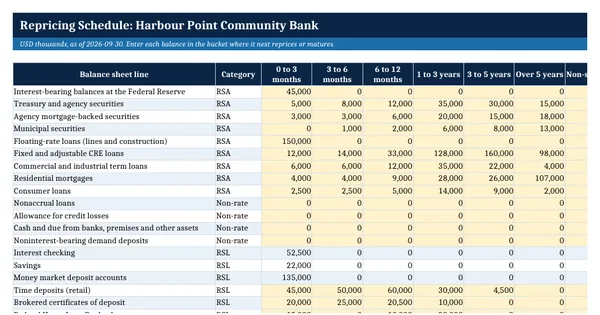
 Excel workbook preview
Bank supervision (OCC, FFIEC, FDIC)
Interest Rate Risk Gap Analysis Template
3 free downloads per account. Just your email and a 6-digit code.
About this template
A repricing gap report sorts a bank's rate-sensitive assets and liabilities by when they mature or reprice, then shows the mismatch in each period. A positive gap means the bank is asset sensitive, so net interest income tends to rise when rates rise. A negative gap means it is liability sensitive. Small banks use the report as a first measure of interest rate risk and as a check on more complex models.
This workbook follows the description of gap analysis in section 7.1 of the FDIC RMS Manual of Examination Policies, including the gap ratio on average earning assets and the way it estimates the change in net interest margin. It adds deposit betas, a time-weighted earnings estimate and shocks up to 400 basis points, which the interagency advisory on interest rate risk suggests a bank should consider.
Who it is for
The CFO or ALCO secretary of a small bank who must show the board and the examiner a current repricing gap report with rate shocks against board limits.
What is inside
- Repricing schedule with 21 balance sheet lines across six time buckets plus a non-sensitive column, worked for a fictional USD 1.2 billion bank
- Non-maturity deposit sheet that applies a sensitivity factor (beta) to each deposit type and feeds the schedule by formula
- Gap Report with rate-sensitive assets and liabilities, periodic and cumulative gap, gap to total assets and RSA to RSL ratio per bucket
- One-year gap ratio on average earning assets, compared with a board limit
- Rate shock table for 8 parallel shocks with net interest margin change, simple and time-weighted net interest income change, and limit status
- Balance check that confirms total assets equal liabilities plus equity
- Notes on the known limits of gap analysis, taken from the FDIC examination manual
How to use it
Enter your balances by repricing bucket on the Repricing Schedule and your deposit betas on the Non-Maturity Deposits sheet.
Files
- XLSXinterest-rate-risk-gap-analysis-template.xlsx13 KB
Opens in Microsoft Word or Excel, Google Docs or Sheets, and LibreOffice. Built on free, official texts that anyone can read: laws, regulations, standards and guidance published by public bodies. A template to adapt, not legal, tax or accounting advice.
Questions about this template
How do you calculate an interest rate gap?
Subtract rate-sensitive liabilities from rate-sensitive assets for each time bucket to get the periodic gap, and add the periodic gaps together to get the cumulative gap. The FDIC examination manual describes a basic gap ratio as rate-sensitive assets minus rate-sensitive liabilities, divided by average earning assets. Multiplying that ratio by a rate change estimates the change in net interest margin.
What does a negative gap mean?
A negative gap means more liabilities than assets reprice in the period, so the bank is liability sensitive. If rates rise, its funding costs reset faster than its asset yields and net interest income may fall. If rates fall, net interest income may rise. The size of the gap relative to total assets shows how strong that effect could be.
Is gap analysis enough to measure interest rate risk?
Usually not on its own. The FDIC manual notes that gap analysis mainly captures repricing risk, assumes parallel rate moves, handles embedded options poorly and does not measure economic value. Only banks with very simple balance sheets should rely on it alone. Most banks use it next to earnings simulation and an economic value of equity measure.
More Bank supervision (OCC, FFIEC, FDIC) templates
Bank supervision (OCC, FFIEC, FDIC)
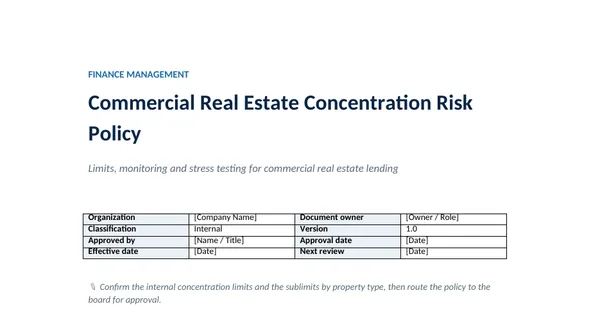
Commercial Real Estate Concentration Risk Policy
Bank supervision (OCC, FFIEC, FDIC)
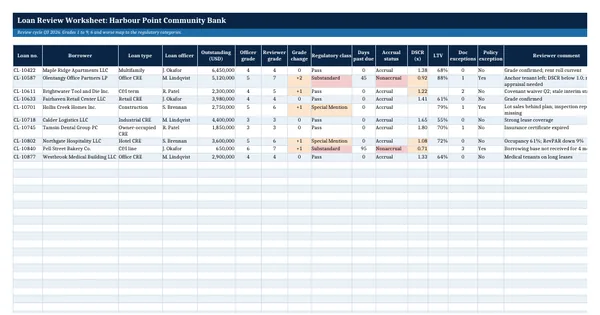
Loan Review Worksheet
Bank supervision (OCC, FFIEC, FDIC)
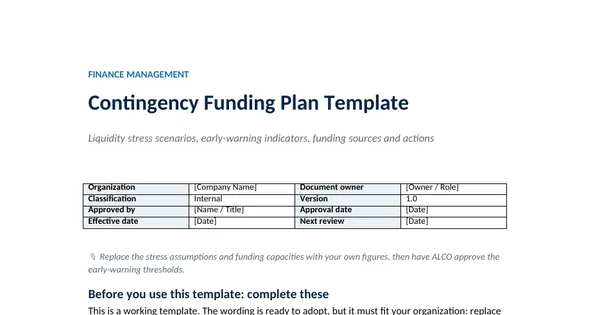
Contingency Funding Plan Template
Basel Framework and BCBS 239