
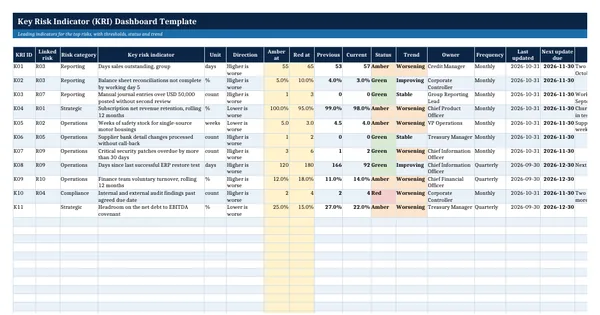
 Excel workbook preview
Key Risk Indicator (KRI) Dashboard Template
3 free downloads per account. Just your email and a 6-digit code.
About this template
A key risk indicator is a measure that signals that a risk is growing before it turns into a loss. A dashboard of indicators lets a risk committee see movement each month rather than wait for the annual risk review. This workbook is for the finance or risk lead who needs a working dashboard that links each indicator to a risk and shows status at a glance.
OMB Circular A-123 describes continuous risk identification, including surveillance of leading indicators of future risk, as part of enterprise risk management. The workbook holds each indicator with its direction, amber and red thresholds, owner and frequency. Current and previous values come from a monthly history sheet, and status, trend, due dates and summary counts are live formulas. Thresholds and values are invented examples.
Who it is for
The risk or finance lead asked by the risk committee or the board to show leading indicators for the top risks, not only a list of risks.
What is inside
- KRI Dashboard sheet with 11 worked indicators for an invented group and 16 blank formatted rows
- Amber and red thresholds per indicator, for indicators where higher is worse or lower is worse
- Live current and previous values pulled from the Monthly History sheet
- Status formula with red, amber and green colour, and a trend formula (improving, worsening, stable)
- Next update due date with overdue highlighting
- Monthly History sheet with 12 months per indicator and gaps allowed
- Summary sheet with counts by status and by risk category
- Dropdowns, freeze panes, filters and print fit
How to use it
Link each indicator to a risk in your risk register, agree the amber and red thresholds, then enter the monthly values on the history sheet.
Files
- XLSXkey-risk-indicator-dashboard-template.xlsx17 KB
Opens in Microsoft Word or Excel, Google Docs or Sheets, and LibreOffice. Built on free, official texts that anyone can read: laws, regulations, standards and guidance published by public bodies. A template to adapt, not legal, tax or accounting advice.
Questions about this template
What makes a good key risk indicator?
It is linked to a specific risk, it moves before the loss happens, it can be measured from data the organization already holds, and it has thresholds agreed in advance. Days sales outstanding for credit risk and overdue reconciliations for reporting risk are typical finance examples.
How are amber and red thresholds set?
They come from the risk appetite and tolerances. The amber threshold is the point where the owner must act and report, and the red threshold is the point where the risk committee must be told. This workbook handles both directions: indicators where higher is worse and indicators where lower is worse.
How often should key risk indicators be updated?
Most finance indicators are updated monthly after the close, and some are updated quarterly. The workbook calculates the next due date from the last update and the frequency, and highlights indicators that are overdue so stale data does not look current.