
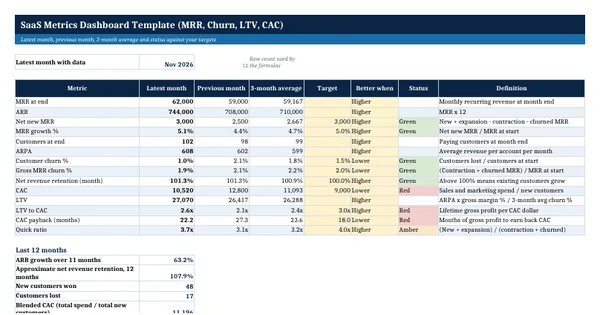
 Excel workbook preview
Startup and small business finance
SaaS Metrics Dashboard Template (MRR, Churn, LTV, CAC)
3 free downloads per account. Just your email and a 6-digit code.
About this template
A SaaS metrics dashboard puts the numbers a subscription business is judged on onto one page: monthly and annual recurring revenue, growth, customer and revenue churn, net revenue retention, average revenue per account, customer acquisition cost, lifetime value and payback. Boards and investors ask for it every month, and buyers rebuild it in diligence, so the definitions have to be stable and the figures have to tie to the ledger.
The workbook takes a short monthly input of customers, the four MRR movements, sales and marketing spend and gross margin. A metrics sheet calculates thirteen measures per month by formula, and a one-page dashboard compares the latest month with the previous month, the three-month average and your own targets, with two charts. It rests on standard subscription finance arithmetic, with every definition written next to the numbers.
Who it is for
The founder or finance lead who has to give the board or investors a monthly SaaS metrics page that ties to the ledger.
What is inside
- Monthly Data sheet with 12 worked months and 12 blank rows: customers, the four MRR movements, sales and marketing spend and gross margin
- Metrics sheet with 13 formulas per month, including net revenue retention, LTV to CAC, CAC payback and quick ratio
- Dashboard with 14 KPIs: latest month, previous month, 3-month average, your target and a green, amber or red status
- Last 12 months block: ARR growth, approximate annual net revenue retention, new and lost customers and blended CAC
- Two charts for the last 12 months: MRR at month end and MRR movements
- Latest month found automatically, so the dashboard moves when a new month is entered
- Definitions of every metric written under the tables
How to use it
Enter the opening customers and MRR, then each month's new and churned customers, MRR movements and sales and marketing spend on the Monthly Data sheet.
Files
- XLSXsaas-metrics-dashboard-template.xlsx21 KB
Opens in Microsoft Word or Excel, Google Docs or Sheets, and LibreOffice. Based on general finance practice, not on one published standard. A template to adapt, not legal, tax or accounting advice.
Questions about this template
How do you calculate net revenue retention?
Net revenue retention compares the recurring revenue from existing customers now with what the same customers paid at the start of the period. For one month the template uses opening MRR plus expansion, minus contraction and churned MRR, divided by opening MRR. Above 100% means existing customers grew faster than they shrank or left.
How is LTV calculated in this template?
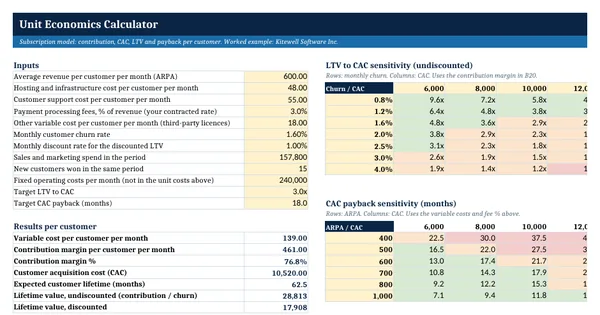
Lifetime value is average revenue per account times gross margin, divided by the monthly customer churn rate. One month of churn is noisy for a small customer base, so the template divides by the average churn of the last three months. The result is the gross profit a typical customer brings over their lifetime.
What is the SaaS quick ratio?
The quick ratio divides the MRR added in a month (new plus expansion) by the MRR lost (contraction plus churn). A ratio of 4 means four dollars of MRR were added for every dollar lost. It shows how efficiently a company grows, because high churn can hide behind strong new sales.