

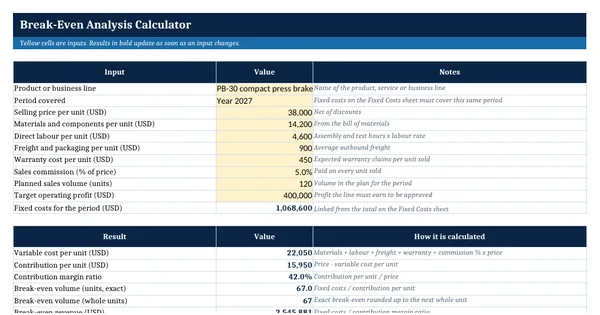
 Excel workbook preview
Budgeting, forecasting and FP&A
Break-Even Analysis Calculator
3 free downloads per account. Just your email and a 6-digit code.
About this template
Break-even analysis shows the sales volume at which revenue exactly covers fixed and variable costs, so a product line makes neither a profit nor a loss. Finance teams use it before a launch, a price change or a new fixed cost such as a lease or a team, to show how much volume the decision needs. The margin of safety then shows how far planned sales can fall before the line loses money.
This calculator works through an invented new press brake line at Ashcombe Group. It derives the contribution per unit from price and five variable cost inputs, adds up fixed costs from a cost list, and returns break-even units and revenue, the volume for a target profit, the margin of safety and operating leverage. A volume table with a chart and a sales mix sheet follow. Every result is a plain formula from general cost volume profit practice.
Who it is for
The finance manager or controller asked how many units a product line must sell to cover its costs before the launch or price decision is approved.
What is inside
- Break-Even sheet with 10 yellow inputs and 15 live results, each with how it is calculated
- Fixed Costs sheet with 10 worked cost lines, 14 blank rows, a category dropdown and a period total
- Break-even units, break-even revenue and the volume needed for a target profit
- Margin of safety in units and percent, with red, amber and green bands
- Degree of operating leverage and a plain-language status line
- Volume Profit Table of 16 volumes with a revenue and total cost chart
- Sales Mix sheet for multi-product break-even with 4 worked products and a mix check
How to use it
Enter the selling price and the variable cost per unit on the Break-Even sheet, then list your fixed costs on the Fixed Costs sheet.
Files
- XLSXbreak-even-analysis-calculator.xlsx17 KB
Opens in Microsoft Word or Excel, Google Docs or Sheets, and LibreOffice. Based on general finance practice, not on one published standard. A template to adapt, not legal, tax or accounting advice.
Questions about this template
How do you calculate the break-even point?
Divide total fixed costs for the period by the contribution per unit, which is the selling price minus the variable cost per unit. The result is the number of units needed to cover all costs. Break-even revenue is fixed costs divided by the contribution margin ratio, which is the contribution per unit as a share of the price.
What is the margin of safety?
The margin of safety is the gap between planned sales and break-even sales. In this calculator it is shown in units and as a percentage of planned volume. A small margin means a modest sales shortfall would turn the line into a loss, so the decision carries more risk.
How does break-even work with several products?
With several products the break-even point depends on the sales mix. The Sales Mix sheet weights each product's contribution per unit by its share of units sold, divides the shared fixed costs by that weighted contribution, and splits the resulting break-even volume back across the products in the same mix.
More Budgeting, forecasting and FP&A templates
Budgeting, forecasting and FP&A
Monthly Management Report Template (CFO Commentary)
Budgeting, forecasting and FP&A
Capital Budgeting Calculator (NPV, IRR, Payback)
Budgeting, forecasting and FP&A
Scenario and Sensitivity Analysis Template
FinOps and cloud cost management