
 Excel workbook preview
Budgeting, forecasting and FP&A
Scenario and Sensitivity Analysis Template
3 free downloads per account. Just your email and a 6-digit code.
About this template
Scenario analysis asks what the results look like if several assumptions change together, such as a downturn that cuts volume, price and collections at once. Sensitivity analysis changes one driver at a time to find which assumptions matter most. Boards, lenders and auditors reviewing going concern often ask for both, because a single-point budget hides how fragile the plan is.
This workbook models an invented manufacturer with a subscription arm across four scenarios. It calculates revenue, gross margin, EBITDA, receivables and cash flow for each, weights them by probability, ranks twelve drivers by their EBITDA swing, and maps EBITDA across a grid of price and volume changes. An assumption log records the evidence and owner for each driver. It uses general financial planning practice and plain formulas only.
Who it is for
The FP&A lead asked by the board or the lender to show what happens to EBITDA and cash if volume, price or costs move away from the plan.
What is inside
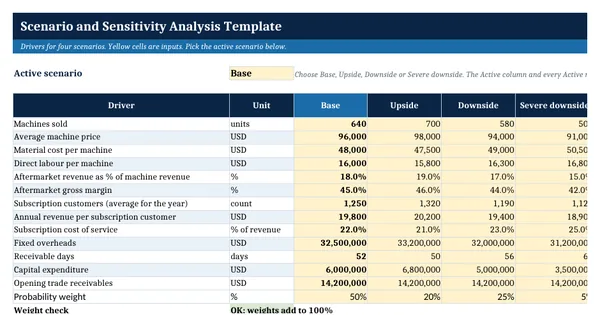
- Scenarios sheet with 13 drivers across base, upside, downside and severe downside, and a scenario selector
- Outputs sheet with 16 lines from revenue to cash flow for the active scenario and all four side by side
- Probability weights per scenario with a 100 percent check and a probability-weighted column
- Sensitivity sheet flexing 12 drivers by an input percentage, ranked by EBITDA swing, with cash flow impact
- Price x Volume grid of 63 EBITDA results with a color scale and editable step inputs
- Assumption Log with 10 worked assumptions, 16 blank rows, confidence dropdown and overdue review flags
- Worked example for an invented manufacturer with a subscription business
How to use it
Enter your own drivers in the four scenario columns on the Scenarios sheet, then pick the active scenario in the yellow selector cell.
Files
- XLSXscenario-and-sensitivity-analysis-template.xlsx20 KB
Opens in Microsoft Word or Excel, Google Docs or Sheets, and LibreOffice. Based on general finance practice, not on one published standard. A template to adapt, not legal, tax or accounting advice.
Questions about this template
What is the difference between scenario and sensitivity analysis?
Sensitivity analysis changes one input at a time and holds the rest constant, which shows which single driver moves the result most. Scenario analysis changes several inputs together to describe a coherent story, such as a recession or a strong year. This workbook does both from the same set of drivers.
How do I build a tornado chart table?
Flex each driver down and up by the same percentage, calculate the result at each end, and take the difference as the swing. Sorting the drivers by swing, largest first, gives the order of the bars in a tornado chart. The Sensitivity sheet calculates the swing and the rank for twelve drivers automatically.
How many scenarios should a budget have?
Three or four is common: a base case, an upside, a downside and sometimes a severe downside for stress testing. More scenarios rarely add insight and are hard to maintain. Each one should be a plausible, internally consistent story with a stated probability, which is how the weights on the Scenarios sheet are meant to be used.