

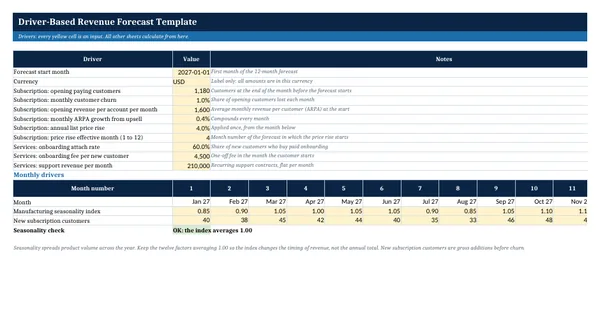
 Excel workbook preview
Budgeting, forecasting and FP&A
Driver-Based Revenue Forecast Template
3 free downloads per account. Just your email and a 6-digit code.
About this template
A driver-based revenue forecast builds revenue from the things that cause it, such as units sold, price, customer numbers and churn, instead of adding a percentage to last year. When a driver moves, the forecast moves with it, so finance can explain every change. It is the model a CFO asks for when the board wants to know what happens to revenue if a price rise slips or new customer sales slow down.
This workbook forecasts twelve months for the invented Ashcombe Group across three streams: product sales from volume, growth, seasonality and price, subscriptions from opening customers, new customers, churn and revenue per account, and services from onboarding and support. A summary compares the forecast with the budget by month and quarter. It uses general financial planning practice and plain spreadsheet formulas only.
Who it is for
The FP&A analyst or finance manager asked by the CFO to replace a top-down revenue guess with a forecast built from volume, price and customer drivers.
What is inside
- Drivers sheet with 11 single inputs, a 12-month seasonality index with a check, and monthly new customers
- Product Lines sheet with 10 worked product lines and 16 blank rows: units, growth, price and price rise month
- Product Revenue sheet that builds 12 months of revenue per line from the drivers, with totals
- Subscriptions sheet: opening, new, churned and closing customers, ARPA, onboarding and support revenue
- Summary sheet with monthly forecast against budget, variance flags and a cumulative total
- Quarterly and full-year totals, revenue mix by stream and a stacked revenue chart
- About 700 live formulas, yellow input cells, dropdowns for channel and price rise month
- How to use sheet with the calculation logic in plain words
How to use it
Enter the forecast start month and the subscription drivers on the Drivers sheet, then replace the ten worked product lines with your own.
Files
- XLSXdriver-based-revenue-forecast-template.xlsx24 KB
Opens in Microsoft Word or Excel, Google Docs or Sheets, and LibreOffice. Based on general finance practice, not on one published standard. A template to adapt, not legal, tax or accounting advice.
Questions about this template
What is a driver-based forecast?
It is a forecast where each revenue line is calculated from operational drivers, for example units times price, or customers times average revenue per account. The drivers are entered once as inputs. Changing a driver updates every month that depends on it, which makes the forecast quicker to refresh and easier to explain than one built from typed totals.
How do I add seasonality to a revenue forecast?
Use a seasonality index with one factor per month that averages 1.00, so busy months sit above 1 and quiet months below. Multiply the underlying monthly volume by the index for that month. This workbook keeps the index on the Drivers sheet and checks that the twelve factors average 1.00, so seasonality moves revenue between months without changing the annual total by accident.
How is subscription revenue forecast here?
Each month starts with the previous month's closing customers, adds new customers and removes churned customers at the monthly churn rate. Revenue is the average customer count for the month times the average revenue per account, which grows by a monthly upsell rate and steps up once in the month of the annual price rise.
More Budgeting, forecasting and FP&A templates
Budgeting, forecasting and FP&A
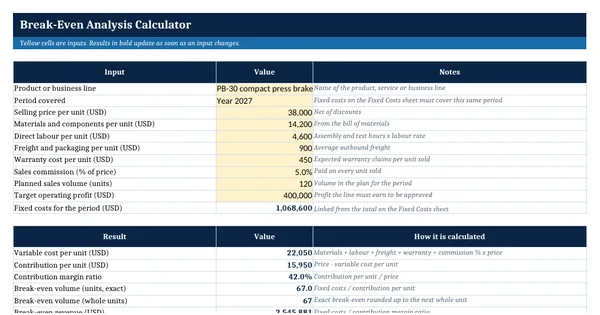
Break-Even Analysis Calculator
Budgeting, forecasting and FP&A
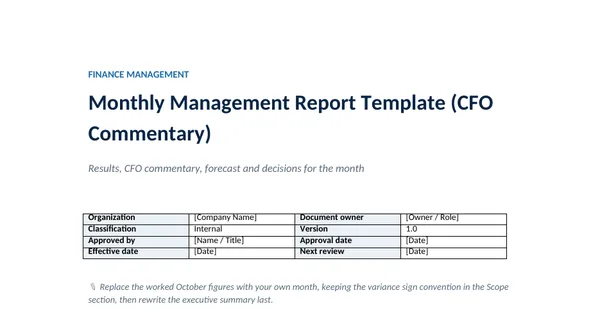
Monthly Management Report Template (CFO Commentary)
Budgeting, forecasting and FP&A
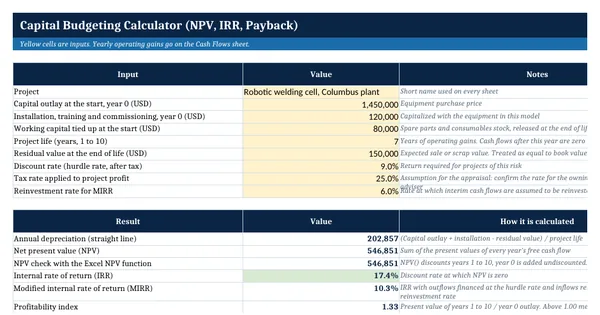
Capital Budgeting Calculator (NPV, IRR, Payback)
Budgeting, forecasting and FP&A