
 Excel workbook preview
Startup and small business finance
Startup Runway and Burn Rate Calculator
3 free downloads per account. Just your email and a 6-digit code.
About this template
A burn rate and runway calculator answers the question every startup board asks first: how many months until the cash runs out. It is needed before a fundraise, when a hiring plan is approved, when revenue slips, and every month in the board pack. Gross burn is all cash going out, net burn is what is left after revenue, and runway is the cash in the bank divided by net burn. The useful version also shows when cash falls below a safety buffer.
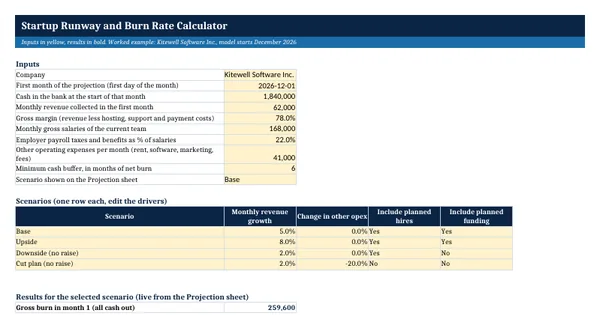
The workbook takes your opening cash, revenue, gross margin, payroll and other costs, then projects 24 months with planned hires, one-off spend and funding events by month. Four scenarios run side by side, so the month cash runs out with and without the next round is visible at once. A burn history sheet works from bank statement actuals and adds the burn multiple and a three-month average runway. It uses standard startup finance arithmetic only, with every formula open to inspection.
Who it is for
The founder or finance lead asked by the board or a lead investor how many months of cash are left and when the next round has to close.
What is inside
- Runway sheet with 10 inputs and 10 live results: gross and net burn, simple runway, first month below zero and below the cash buffer
- 24-month Projection sheet with 17 columns, revenue growth, hiring, one-off spend and funding by month
- 4 scenarios side by side (Base, Upside, Downside with no raise, Cut plan) with a closing cash line chart
- Hires and Events sheet with 6 planned hires and 5 one-off or funding events, plus blank rows
- Burn History sheet with 12 worked months of actuals and 12 blank rows: net burn, burn multiple, 3-month average and runway
- Minimum cash buffer in months of net burn, with amber flags on the months below it and red on negative cash
- Every output is a live formula, inputs are marked in yellow, and a how-it-is-calculated note sits under the results
How to use it
Enter your bank balance, monthly revenue, salaries and other costs on the Runway sheet, then list planned hires and funding on the Hires and Events sheet.
Files
- XLSXstartup-runway-and-burn-rate-calculator.xlsx26 KB
Opens in Microsoft Word or Excel, Google Docs or Sheets, and LibreOffice. Based on general finance practice, not on one published standard. A template to adapt, not legal, tax or accounting advice.
Questions about this template
What is the difference between gross burn and net burn?
Gross burn is the total cash a company pays out in a month: salaries, rent, hosting, software, marketing and any one-off spend. Net burn is gross burn minus the cash that came in from customers in the same month. Runway uses net burn, because revenue pays part of the bill. A company with no revenue has the same gross and net burn.
How do you calculate runway?
Runway in months is the cash in the bank divided by monthly net burn. A single month can mislead, so the calculator also shows runway on the average net burn of the last three months and a month-by-month projection that includes planned hires and revenue growth. Funding is counted only in the month it is received.
What is a burn multiple?
The burn multiple is net burn divided by net new annual recurring revenue in the same period. It shows how much cash the company spends to add one dollar of ARR, so a lower number is better. The Burn History sheet works it out each month from the change in MRR and shows n/a when ARR did not grow.