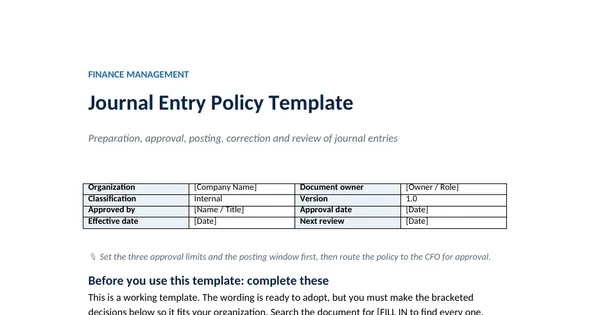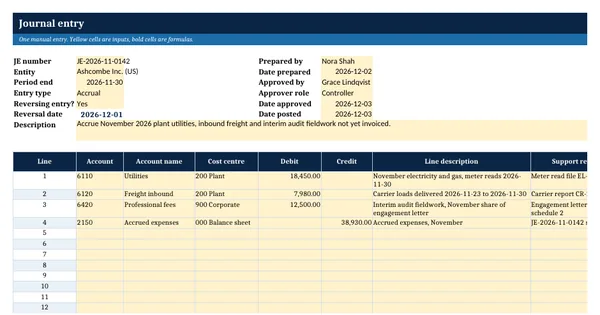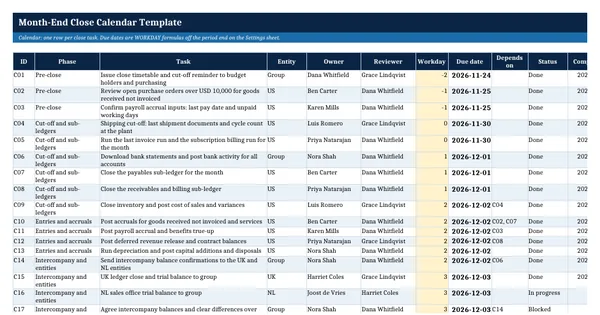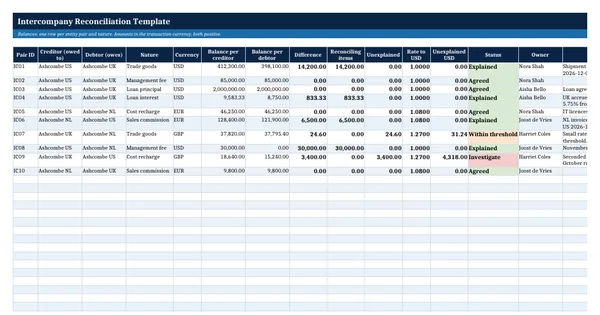

 Excel workbook preview
Flux Analysis Template (Balance Sheet and P&L Variance)
3 free downloads per account. Just your email and a 6-digit code.
About this template
A flux analysis, or fluctuation analysis, compares each balance sheet and income statement line with an earlier period and explains the significant movements. Controllers run it before signing off the month because it catches misposted entries, missed accruals and cut-off errors. Auditors use the same technique, so a documented flux with clear explanations shortens their questions. It is also the quickest way for a new CFO to see what drove the month.
The workbook has a balance sheet sheet and a P&L sheet. Each line shows the change in amount and percent and a flag when it passes your thresholds, with a separate pair for each statement. Flagged lines need a driver and an explanation, and empty ones turn red. Checks prove the balance sheet balances and net income agrees to retained earnings. It rests on general accounting practice.
Who it is for
The controller or senior accountant who must document why balances moved before the month is signed off and the auditor asks.
What is inside
- Balance Sheet Flux with 14 worked accounts and P&L Flux with 14 worked lines, each with 16 blank rows
- Change in amount and percent by formula, New for lines that were zero
- Over threshold flag using separate amount and percent thresholds for the balance sheet and the P&L, with a Both or Either rule
- Driver dropdown with 9 causes and a red cell when a flagged line has no explanation
- Balance check (assets against liabilities and equity) and a check that net income agrees to the retained earnings movement
- Summary sheet: lines, over threshold, explained, explanation missing and reviewed per statement
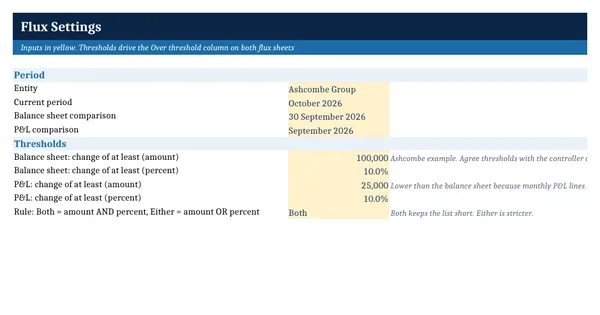
- Settings sheet for periods, thresholds and the rule
How to use it
Set the periods and thresholds on the Settings sheet, then paste the current and comparison trial balance into both flux sheets.
Files
- XLSXflux-analysis-template.xlsx19 KB
Opens in Microsoft Word or Excel, Google Docs or Sheets, and LibreOffice. Based on general finance practice, not on one published standard. A template to adapt, not legal, tax or accounting advice.
Questions about this template
What is a flux analysis in accounting?
It is a review of how each account changed between two periods, usually the current month against the prior month or the same month last year. Lines that moved more than a set amount or percentage are explained in plain words with the cause and whether it will recur. It is a standard step in the month-end review before sign-off.
What threshold should I use for a flux analysis?
Pick an amount and a percentage that match the size of your accounts, and agree them with your controller and auditor. Many teams use a lower amount for the P&L than for the balance sheet. This template keeps separate thresholds for each statement and lets you require both tests or either one. The figures in the file are only an example.
What makes a good flux explanation?
A good explanation names the cause, gives the amount where it helps, and says whether the change will recur, for example annual renewals billed in advance and released over twelve months. Words such as timing or business as usual on their own do not explain anything. The driver dropdown helps you group causes, but the sentence does the work.