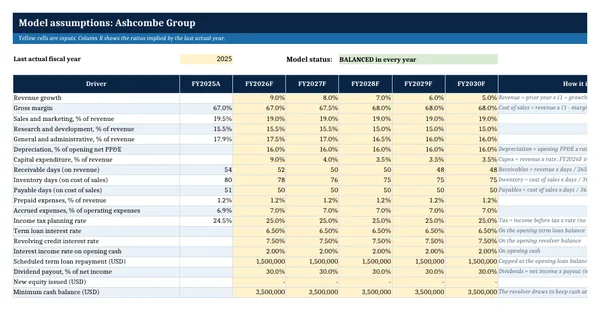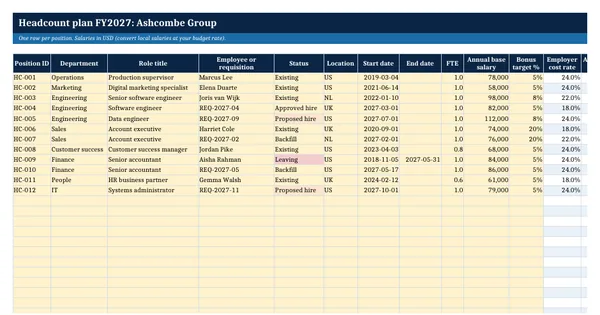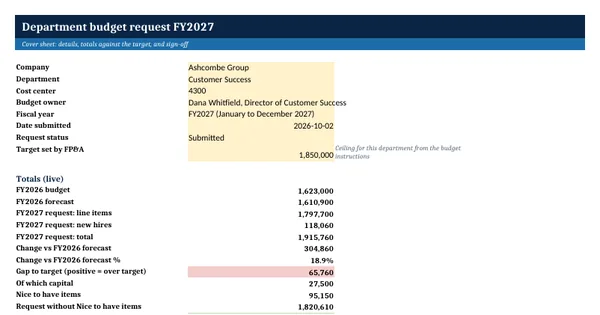

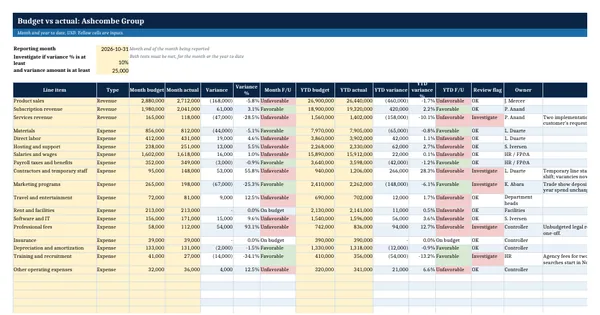
 Excel workbook preview
Budgeting, forecasting and FP&A
Budget vs Actual Variance Analysis Template
3 free downloads per account. Just your email and a 6-digit code.
About this template
A budget versus actual report compares what the business planned to earn and spend with what really happened, for the month and for the year to date. It is the core of the monthly management pack. Budget holders, the CFO and the board use it to see where results are drifting, and auditors and lenders often ask how management monitors performance against plan. The useful part is not the arithmetic but the explanation of the few variances that matter.
This workbook calculates every variance in dollars and percent, sets favorable or unfavorable from the line type, and flags lines that breach both a percent and a dollar threshold so the review focuses on what is material. A log records the driver, explanation, action and owner for each investigated variance. A price and volume calculator splits revenue variances into their two causes. It rests on general management accounting practice and cites no standard.
Who it is for
The controller or finance manager who has to explain to the CFO, the board or a budget holder why actual results differ from budget this month.
What is inside
- Variance report with 18 worked P&L lines and 8 blank lines: month and year-to-date budget, actual, variance in dollars and percent
- Favorable or unfavorable set by formula from the line type, so revenue and expense variances read the right way round
- Two investigation thresholds (percent and dollars) as inputs; lines that breach both are flagged Investigate in red
- Totals for revenue, expenses and net result for the month and year to date, all by formula
- Variance log with 10 worked explanations and 20 blank rows: driver dropdown, action, owner, due date, status and days overdue
- Price and volume calculator that splits a revenue variance into volume and price effects for up to 6 products, with a check column
- Summary sheet with totals, the count of flagged and unfavorable lines, and open and overdue actions
How to use it
Enter the reporting month and your two thresholds, then paste budget and actual figures for the month and year to date.
Files
- XLSXbudget-vs-actual-variance-analysis-template.xlsx19 KB
Opens in Microsoft Word or Excel, Google Docs or Sheets, and LibreOffice. Based on general finance practice, not on one published standard. A template to adapt, not legal, tax or accounting advice.
Questions about this template
How do you calculate a budget variance?
Subtract the budget from the actual figure to get the variance in currency, then divide by the budget to get the variance in percent. Whether it is favorable depends on the line: more revenue than budget is favorable, while more expense than budget is unfavorable. This workbook reads the line type and applies the right sign automatically.
Which variances should be investigated?
Set a threshold so the team explains only material variances. A common approach uses two tests together, a percent of budget and a minimum amount, so that a large percent on a tiny line and a small percent on a huge line are both ignored. The thresholds are your choice and should be agreed with the CFO or the audit committee.
What is a price and volume variance?
A revenue variance can come from selling a different quantity or at a different price. The volume effect is the change in units times the budget price. The price effect is the change in price times the actual units. Together they add up to the total revenue variance, which the calculator in this workbook checks for every product.